Hydrogeology of Rwanda: Difference between revisions
No edit summary |
No edit summary |
||
| Line 108: | Line 108: | ||
| [[File: | | [[File:Rwanda_Geology.png | center | thumb| 500px | Geology of Rwanda at 1:5 million scale. Developed from USGS map (Persits et al. 2002). For more information on the map development and datasets see the [[Geology | geology resource page]].]] | ||
|} | |} | ||
Revision as of 15:03, 25 April 2016
Africa Groundwater Atlas >> Hydrogeology by country >> Hydrogeology of Rwanda
This page has limited information and needs to be updated. If you have more information on the hydrogeology of Rwanda, please get in touch!
Compilers
Dr Kirsty Upton and Brighid Ó Dochartaigh, British Geological Survey, UK
Please cite this page as: Upton & Ó Dochartaigh, 2016.
Bibliographic reference: Upton, K. & Ó Dochartaigh, B.É. 2016. Africa Groundwater Atlas: Hydrogeology of Rwanda. British Geological Survey. Accessed [date you accessed the information]. https://earthwise.bgs.ac.uk/index.php/Hydrogeology_of_Rwanda
Terms and conditions
The Africa Groundwater Atlas is hosted by the British Geological Survey (BGS) and includes information from third party sources. Your use of information provided by this website is at your own risk. If reproducing diagrams that include third party information, please cite both the Africa Groundwater Atlas and the third party sources. Please see the Terms and Conditions for more information.
Geographical Setting

General
| Estimated Population in 2013* | 11,776,522 |
| Rural Population (% of total) (2013)* | 73.1% |
| Total Surface Area* | 24,670 sq km |
| Agricultural Land (% of total area) (2012)* | 75.3% |
| Capital City | Kigali |
| Region | Eastern Africa |
| Border Countries | Uganda, Tanzania, Burundi, the Democratic Republic of the Congo |
| Annual Freshwater Withdrawal (2013)* | 150 Million cubic metres |
| Annual Freshwater Withdrawal for Agriculture (2013)* | 68% |
| Annual Freshwater Withdrawal for Domestic Use (2013)* | 24% |
| Annual Freshwater Withdrawal for Industry (2013)* | 8% |
| Rural Population with Access to Improved Water Source (2012)* | 68.3% |
| Urban Population with Access to Improved Water Source (2012)* | 80.7% |
* Source: World Bank
Climate
These maps and graphs were developed from the CRU TS 3.21 dataset produced by the Climatic Research Unit at the University of East Anglia, UK. For more information see the climate resource page.
-

Koppen Geiger Climate Zones
-

Average Annual Precipitation
-
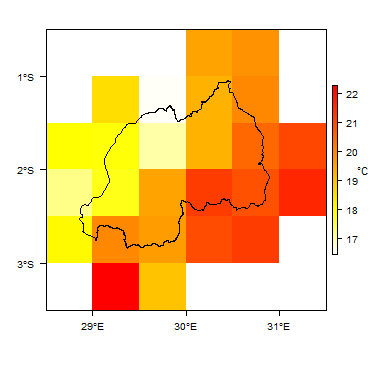
Average Temperature


Surface water
|
|
 |
Soil
 |
Land cover

GeologyThe geology map shows a simplified overview of geology at a national scale (see the Geology resource page for more details). More information is available in the report UN (1988) (see References section, below).
HydrogeologyThe hydrogeology map below shows a simplified overview of the type and productivity of the main aquifers at a national scale (see the Hydrogeology map resource page for more details). More information on the hydrogeology of Rwanda is available in the report United Nations (1988) (see References section, below).
Transboundary aquifersFor further information about transboundary aquifers, please see the Transboundary aquifers resources page. ReferencesReferences with more information on the geology and hydrogeology of Rwanda can be accessed through the Africa Groundwater Literature Archive.
Return to the index pagesAfrica Groundwater Atlas >> Hydrogeology by country >> Hydrogeology of Rwanda
|


