Hydrogeology of Swaziland: Difference between revisions
No edit summary |
No edit summary |
||
| Line 19: | Line 19: | ||
==Geographical Setting== | ==Geographical Setting== | ||
[[File:Swaziland_Political.png | right | frame | Swaziland | [[File:Swaziland_Political.png | right | frame | Swaziland. Map developed from USGS GTOPOPO30; GADM global administrative areas; and UN Revision of World Urbanization Prospects. For more information on the map development and datasets see the [[Geography | geography resource page]].]] | ||
===General=== | ===General=== | ||
| Line 57: | Line 57: | ||
===Climate=== | ===Climate=== | ||
These maps and graphs were developed from the CRU TS 3.21 dataset produced by the Climatic Research Unit at the University of East Anglia, UK. For more information see the [[Climate | climate resource page]]. | |||
<gallery widths="375px" heights=365px mode=nolines> | <gallery widths="375px" heights=365px mode=nolines> | ||
| Line 66: | Line 68: | ||
[[File:Swaziland_pre_Monthly.png| 255x124px| Average monthly precipitation for Swaziland showing minimum and maximum (light blue), 25th and 75th percentile (blue), and median (dark blue) rainfall]] [[File:Swaziland_tmp_Monthly.png| 255x124px| Average monthly temperature for Swaziland showing minimum and maximum (orange), 25th and 75th percentile (red), and median (black) temperature]] [[File:Swaziland_pre_Qts.png | 255x124px | Quarterly precipitation over the period 1950-2012]] [[File:Swaziland_pre_Mts.png|255x124px | Monthly precipitation (blue) over the period 2000-2012 compared with the long term monthly average (red)]] | [[File:Swaziland_pre_Monthly.png| 255x124px| Average monthly precipitation for Swaziland showing minimum and maximum (light blue), 25th and 75th percentile (blue), and median (dark blue) rainfall]] [[File:Swaziland_tmp_Monthly.png| 255x124px| Average monthly temperature for Swaziland showing minimum and maximum (orange), 25th and 75th percentile (red), and median (black) temperature]] [[File:Swaziland_pre_Qts.png | 255x124px | Quarterly precipitation over the period 1950-2012]] [[File:Swaziland_pre_Mts.png|255x124px | Monthly precipitation (blue) over the period 2000-2012 compared with the long term monthly average (red)]] | ||
===Surface water=== | ===Surface water=== | ||
| Line 75: | Line 77: | ||
| [[File:Swaziland_Hydrology.png | frame | major surface water features of Swaziland | | [[File:Swaziland_Hydrology.png | frame | major surface water features of Swaziland. Map developed from World Wildlife Fund HydroSHEDS; Digital Chart of the World drainage; and FAO Inland Water Bodies. For more information on the map development and datasets see the [[Surface water | surface water resource page]].]] | ||
| | |||
|} | |} | ||
| Line 81: | Line 84: | ||
{| | {| | ||
|- | |- | ||
| [[File:Swaziland_soil.png | frame | Soil Map of Swaziland | | [[File:Swaziland_soil.png | frame | Soil Map of Swaziland, from the European Commission Joint Research Centre: European Soil Portal. For more information on the map see the [[Soil | soil resource page]].]] | ||
| | | | ||
| Line 91: | Line 94: | ||
| | | | ||
| [[File:Swaziland_LandCover.png | frame | Land Cover Map of Swaziland | | [[File:Swaziland_LandCover.png | frame | Land Cover Map of Swaziland, from the European Space Agency GlobCover 2.3, 2009. For more information on the map see the [[Land cover | land cover resource page]].]] | ||
| | |||
|} | |} | ||
| Line 98: | Line 102: | ||
==Geology== | ==Geology== | ||
The geology map shows a simplified | The geology map shows a simplified overview of the geology at a national scale (see the [[Geology | Geology resource page]] for more details). More information is available in the report [https://www.bgs.ac.uk/africagroundwateratlas/fulldetails.cfm?id=AGLA060022 UN (1989)] (see References section, below). | ||
{| | {| | ||
| Line 105: | Line 109: | ||
| [[File:Swaziland_Geology.png | | | [[File:Swaziland_Geology.png | center | thumb| 500px | Geology of Swaziland at 1:5 million scale. Developed from USGS map (Persits et al. 2002). For more information on the map development and datasets see the [[Geology | geology resource page]].]] | ||
| | |||
|} | |} | ||
==Hydrogeology== | ==Hydrogeology== | ||
The hydrogeology map below shows a simplified | The hydrogeology map below shows a simplified overview of the type and productivity of the main aquifers at a national scale (see the [[Hydrogeology Map | Hydrogeology map resource page]] for more details). | ||
| Line 117: | Line 122: | ||
[[File:Swaziland_Hydrogeology.png]] [[File: Hydrogeology_Key.png | 500x195px]] | [[File:Swaziland_Hydrogeology.png]] [[File: Hydrogeology_Key.png | 500x195px]] | ||
Revision as of 15:24, 25 April 2016
Africa Groundwater Atlas >> Hydrogeology by country >> Hydrogeology of Swaziland
This page has limited information and needs to be updated. If you have more information on the hydrogeology of Swaziland, please get in touch!
Compilers
Dr Kirsty Upton and Brighid Ó Dochartaigh, British Geological Survey, UK
Please cite this page as: Upton & Ó Dochartaigh, 2016.
Bibliographic reference: Upton, K. & Ó Dochartaigh, B.É. 2016. Africa Groundwater Atlas: Hydrogeology of Swaziland. British Geological Survey. Accessed [date you accessed the information]. https://earthwise.bgs.ac.uk/index.php/Hydrogeology_of_Swaziland
Terms and conditions
The Africa Groundwater Atlas is hosted by the British Geological Survey (BGS) and includes information from third party sources. Your use of information provided by this website is at your own risk. If reproducing diagrams that include third party information, please cite both the Africa Groundwater Atlas and the third party sources. Please see the Terms and Conditions for more information.
Geographical Setting

General
| Estimated Population in 2013* | 1,249,514 |
| Rural Population (% of total) (2013)* | 78.7% |
| Total Surface Area* | 17,200 sq km |
| Agricultural Land (% of total area) (2012)* | 71% |
| Capital City | Lobamba (royal / legislative); Mbabane (administrative) |
| Region | Southern Africa |
| Border Countries | Mozambique, South Africa |
| Annual Freshwater Withdrawal (2013)* | 1,042 Million cubic metres |
| Annual Freshwater Withdrawal for Agriculture (2013)* | 96.6% |
| Annual Freshwater Withdrawal for Domestic Use (2013)* | 2.6% |
| Annual Freshwater Withdrawal for Industry (2013)* | 1.2% |
| Rural Population with Access to Improved Water Source (2012)* | 68.9% |
| Urban Population with Access to Improved Water Source (2012)* | 93.6% |
* Source: World Bank
Climate
These maps and graphs were developed from the CRU TS 3.21 dataset produced by the Climatic Research Unit at the University of East Anglia, UK. For more information see the climate resource page.
-
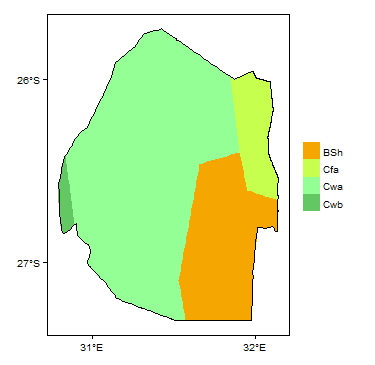
Koppen Geiger Climate Zones
-

Average Annual Precipitation
-
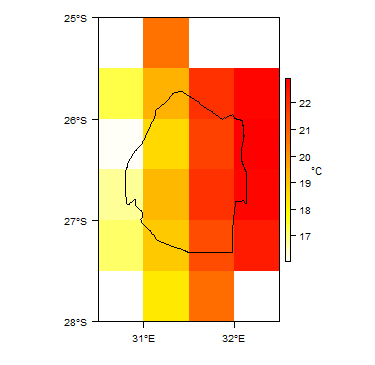
Average Temperature


Surface water
|
|
 |
Soil
 |
Land cover
 |
Geology
The geology map shows a simplified overview of the geology at a national scale (see the Geology resource page for more details). More information is available in the report UN (1989) (see References section, below).
|
|
 |
Hydrogeology
The hydrogeology map below shows a simplified overview of the type and productivity of the main aquifers at a national scale (see the Hydrogeology map resource page for more details).
More information on the hydrogeology of Swaziland is available in the report United Nations (1989) (see References section, below).


Transboundary aquifers
For further information about transboundary aquifers, please see the Transboundary aquifers resources page.
References
References with more information on the geology and hydrogeology of Swaziland can be accessed through the Africa Groundwater Literature Archive.
United Nations. 1989. Groundwater in Eastern, Central and Southern Africa: Swaziland. United Nations Department of Technical Cooperation for Development.
Return to the index pages
Africa Groundwater Atlas >> Hydrogeology by country >> Hydrogeology of Swaziland