Hydrogeology of Swaziland
Africa Groundwater Atlas >> Hydrogeology by country >> Hydrogeology of Swaziland
This page has limited information and needs to be updated. If you have more information on the hydrogeology of Swaziland, please get in touch!
The earliest known inhabitants of present-day Swaziland were Khoisan hunter gatherers, before Bantu people migrated into the area, possibly from the 4th century AD. Swazi people migrated in the 18th century, forming the present day kingdom in the mid-19th century. The ruling monarch granted land concessions to many Europeans in the late 19th century. From the late 19th century South Africa and later Britain held power, and Swaziland was influenced by tensions between British and Boers over the area of present-day South Africa. Under King Sobhuza, who was crowned in 1921, British colonial rule and the influence of South Africa gradually weakened, and Swaziland became fully independent in 1968. Following independence, the King continued to rule as an absolute monarch, with no democratic political parties. The country was relatively stable and saw gradual economic development. Civil protests in the 1990s were followed by reforms and the first elections under a new constitution in 2008. There has been further civil pressure for more reform since.
The economy is fairly diverse, with agriculture, forestry, mining, services and manufacturing – particularly textiles – all contributing. The economy is closely linked to that of South Africa. The livelihoods of most of the population depend on subsistence smallholder arable and livestock farming, while large-scale commercial farming of crops such as sugar and citrus fruit generate export income. Remittances from South Africa, especially from the mining sector, are also important to the livelihoods of much of the population. Since the 1980s there has been little economic growth, related to various factors including government spending, reduction in tax receipts, reductions in textile exports to international markets, and the effect of HIV-AIDS – Swaziland has the highest HIV-AIDS infection rate in the world.
Swaziland has relatively abundant water resources, with relatively high rainfall in upland areas, and a number of permanent rivers, with many major dams used for irrigation, hydroelectricity and tourism. There are no major aquifers, but groundwater is widely used for domestic water supplies, especially in drier areas.
Compilers
Dr Kirsty Upton and Brighid Ó Dochartaigh, British Geological Survey, UK
Dr Imogen Bellwood-Howard, Institute of Development Studies, UK
Please cite this page as: Upton, Ó Dochartaigh and Bellwood-Howard, 2018.
Bibliographic reference: Upton K, Ó Dochartaigh BÉ and Bellwood-Howard, I. 2018. Africa Groundwater Atlas: Hydrogeology of Swaziland. British Geological Survey. Accessed [date you accessed the information]. https://earthwise.bgs.ac.uk/index.php/Hydrogeology_of_Swaziland
Terms and conditions
The Africa Groundwater Atlas is hosted by the British Geological Survey (BGS) and includes information from third party sources. Your use of information provided by this website is at your own risk. If reproducing diagrams that include third party information, please cite both the Africa Groundwater Atlas and the third party sources. Please see the Terms of use for more information.
Geographical Setting

General
| Capital city | Lomamba (royal / legislative); Mbabane (administrative) |
| Region | Southern Africa |
| Border countries | Mozambique, South Africa |
| Total surface area* | 17,360 km2 (1,736,000 ha) |
| Total population (2015)* | 1,286,900 |
| Rural population (2015)* | 1,013,000 (79%) |
| Urban population (2015)* | 273,900 (21%) |
| UN Human Development Index (HDI) [highest = 1] (2014)* | 0.5306 |
* Source: FAO Aquastat
Climate
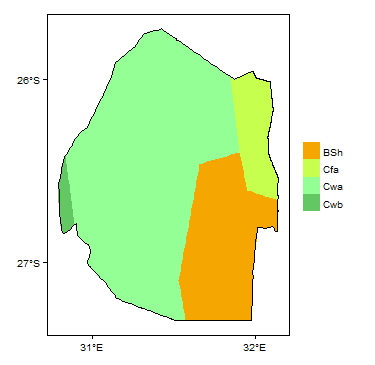
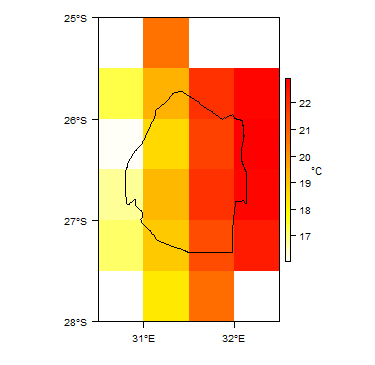
More information on average rainfall and temperature for each of the climate zones in Swaziland can be seen at the Swaziland climate page.
These maps and graphs were developed from the CRU TS 3.21 dataset produced by the Climatic Research Unit at the University of East Anglia, UK. For more information see the climate resource page.
Surface water
|
|
 |
Soil
 |
Land cover
 |
Water statistics
| 1998 | 2000 | 2002 | 2005 | 2014 | 2015 | |
| Rural population with access to safe drinking water (%) | 68.9 | |||||
| Urban population with access to safe drinking water (%) | 93.6 | |||||
| Population affected by water related disease | 2,926 | |||||
| Total internal renewable water resources (cubic metres/inhabitant/year) | 2,051 | |||||
| Total exploitable water resources (Million cubic metres/year) | No data | No data | No data | No data | No data | |
| Freshwater withdrawal as % of total renewable water resources | 23.1 | |||||
| Renewable groundwater resources (Million cubic metres/year) | No data | No data | No data | No data | No data | |
| Groundwater produced internally (Million cubic metres/year) | 660 | |||||
| Fresh groundwater withdrawal (primary and secondary) (Million cubic metres/year) | No data | No data | No data | No data | No data | |
| Groundwater: entering the country (total) (Million cubic metres/year) | No data | No data | No data | No data | No data | |
| Groundwater: leaving the country to other countries (total) (Million cubic metres/year) | No data | No data | No data | No data | No data | |
| Industrial water withdrawal (all water sources) (Million cubic metres/year) | 20.7 | |||||
| Municipal water withdrawal (all water sources) (Million cubic metres/year) | 41.3 | |||||
| Agricultural water withdrawal (all water sources) (Million cubic metres/year) | 1,006 | |||||
| Irrigation water withdrawal (all water sources) 1 (Million cubic metres/year) | 993 | |||||
| Irrigation water requirement (all water sources) 1 (Million cubic metres/year) | 313 | |||||
| Area of permanent crops (ha) | 15,000 | |||||
| Cultivated land (arable and permanent crops) (ha) | 190,000 | |||||
| Total area of country cultivated (%) | 10.94 | |||||
| Area equipped for irrigation by groundwater (ha) | 1,000 | |||||
| Area equipped for irrigation by mixed surface water and groundwater (ha) | No data | No data | No data | No data | No data |
These statistics are sourced from FAO Aquastat. They are the most recent available information in the Aquastat database. More information on the derivation and interpretation of these statistics can be seen on the FAO Aquastat website.
Further water and related statistics can be accessed at the Aquastat Main Database.
1 More information on irrigation water use and requirement statistics
Geology
The geology map shows a simplified overview of the geology at a national scale (see the Geology resource page for more details). More information is available in the report UN (1989) (see References section, below).
|
|
 |
Hydrogeology
The hydrogeology map below shows a simplified overview of the type and productivity of the main aquifers at a national scale (see the Hydrogeology map resource page for more details).
More information on the hydrogeology of Swaziland is available in the report United Nations (1989) (see References section, below).
Swaziland is also covered by the SADC hydrogeological map and atlas (2010), available through the SADC Groundwater Information Portal.
Transboundary aquifers
For further information about transboundary aquifers, please see the Transboundary aquifers resources page.
References
Online resources
SADC Groundwater Information Portal
General information on surface water and groundwater resources in SADC
References with more information on the geology and hydrogeology of Swaziland can be accessed through the Africa Groundwater Literature Archive.
United Nations. 1989. Groundwater in Eastern, Central and Southern Africa: Swaziland. United Nations Department of Technical Cooperation for Development.
Return to the index pages
Africa Groundwater Atlas >> Hydrogeology by country >> Hydrogeology of Swaziland


