Hydrogeology of Burundi: Difference between revisions
| Line 103: | Line 103: | ||
==Hydrogeology== | ==Hydrogeology== | ||
The hydrogeology map shows a simplified version of the type and productivity of the main aquifers at a national scale. More information is available in the report [ | The hydrogeology map shows a simplified version of the type and productivity of the main aquifers at a national scale. More information is available in the report [http://www.bgs.ac.uk/africagroundwateratlas/fulldetails.cfm?id=AGLA060003 UN (1988)] (see References section, below). | ||
| Line 111: | Line 111: | ||
| File:Burundi_Hydrogeology.png]] [[File: Hydrogeology_Key.png | 500x195px]] | frame | Simplified hydrogeology map of Burundi (For more information on the datasets used in the map see the[[Aquifer properties| the Aquifer properties resource page]] )]] | | [[File:Burundi_Hydrogeology.png]] [[File: Hydrogeology_Key.png | 500x195px]] | frame | Simplified hydrogeology map of Burundi (For more information on the datasets used in the map see the[[Aquifer properties| the Aquifer properties resource page]] )]] | ||
|} | |} | ||
Revision as of 13:44, 22 September 2015
Africa Groundwater Atlas >> Hydrogeology by country >> Hydrogeology of Burundi
If you have more recent information on the hydrogeology of Burundi, please get in touch.
Compilers
Dr Kirsty Upton and Brighid Ó Dochartaigh, British Geological Survey, UK
Geographical Setting

General
| Estimated Population in 2013* | 10,162,532 |
| Rural Population (% of total) (2013)* | 88.5% |
| Total Surface Area* | 25,680 sq km |
| Agricultural Land (% of total area) (2012)* | 75.3% |
| Capital City | Bujumbura |
| Region | Eastern/Central Africa |
| Border Countries | Rwanda, Tanzania, the Democratic Republic of the Congo to the west |
| Annual Freshwater Withdrawal (2013)* | 288 Million cubic metres |
| Annual Freshwater Withdrawal for Agriculture (2013)* | 77.1% |
| Annual Freshwater Withdrawal for Domestic Use (2013)* | 17% |
| Annual Freshwater Withdrawal for Industry (2013)* | 5.9% |
| Rural Population with Access to Improved Water Source (2012)* | 73.2% |
| Urban Population with Access to Improved Water Source (2012)* | 91.5% |
* Source: World Bank
Climate
-
 Koppen Geiger Climate Zones
 -
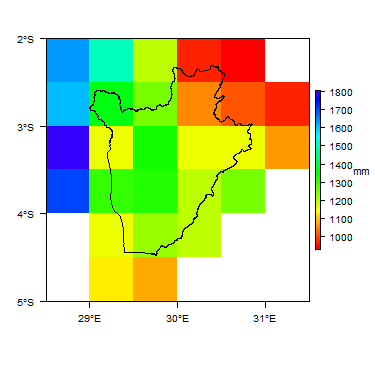 Average Annual Precipitation
 -
 Average Temperature


For further detail on the climate datasets used see the climate resources section.
Surface water
|
|
 |
Soil
 |
Land cover
 |
Geology
The geology map shows a simplified version of the geology at a national scale. More information is available in the report UN (1988) (see References section, below).
|
|
 |
Hydrogeology
The hydrogeology map shows a simplified version of the type and productivity of the main aquifers at a national scale. More information is available in the report UN (1988) (see References section, below).
|
|
  | frame | Simplified hydrogeology map of Burundi (For more information on the datasets used in the map see the the Aquifer properties resource page )]] | frame | Simplified hydrogeology map of Burundi (For more information on the datasets used in the map see the the Aquifer properties resource page )]]
|
Transboundary aquifers
For further information about transboundary aquifers, please see the Transboundary aquifers resources page
References
References with more information on the geology and hydrogeology of Burundi can be accessed through the Africa Groundwater Literature Archive.
United Nations. 1989. Groundwater in Eastern, Central and Southern Africa: Burundi. United Nations Department of Technical Cooperation for Development.
Return to the index pages
Africa Groundwater Atlas >> Hydrogeology by country >> Hydrogeology of Burundi