Climate of Tunisia

From MediaWiki
Jump to navigation Jump to search

Africa Groundwater Atlas >> Hydrogeology by country >> Hydrogeology of Tunisia >> Climate of Tunisia

L'Atlas de l'eau souterraine en Afrique >> Hydrogéologie par pays >> Hydrogéologie de la Tunisie >> Climat de la Tunisie


Climate zones / Zones climatiques

These maps and graphs were developed from the CRU TS 3.21 dataset produced by the Climatic Research Unit at the University of East Anglia, UK. For more information see the climate resource page.

Ces cartes et graphiques ont été développés à partir de l'ensemble de données CRU TS 3.21 produit par l'Unité de recherche climatique à l'Université de East Anglia, au Royaume-Uni. Pour plus d'informations, consultez la page de la ressource climatique (en anglais).


Koppen Geiger Climate Zones

Climate for BSh region (Arid Steppe (hot) / Steppe Aride (chaud) )

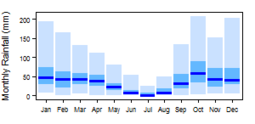
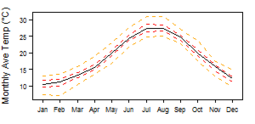
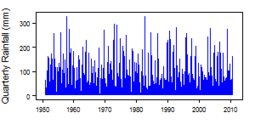
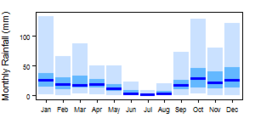
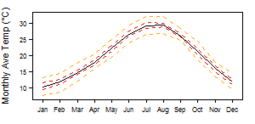
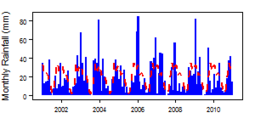
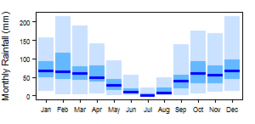
Average monthly precipitation showing minimum and maximum (light blue), 25th and 75th percentile (blue), and median (dark blue) rainfall Average monthly temperature showing minimum and maximum (orange), 25th and 75th percentile (red), and median (black) temperature Quarterly precipitation over the period 1950-2012 Monthly precipitation (blue) over the period 2000-2012 compared with the long term monthly average (red)


Climate for BWh region (Arid Desert (hot) / Désert Aride (chaud) )

Average monthly precipitation showing minimum and maximum (light blue), 25th and 75th percentile (blue), and median (dark blue) rainfall Average monthly temperature showing minimum and maximum (orange), 25th and 75th percentile (red), and median (black) temperature Quarterly precipitation over the period 1950-2012 Monthly precipitation (blue) over the period 2000-2012 compared with the long term monthly average (red)


Climate for Csa region (Temperate with dry summer (hot summer) / Tempéré avec l'été sec (été chaud) )

Average monthly precipitation showing minimum and maximum (light blue), 25th and 75th percentile (blue), and median (dark blue) rainfall Average monthly temperature showing minimum and maximum (orange), 25th and 75th percentile (red), and median (black) temperature Quarterly precipitation over the period 1950-2012 Monthly precipitation (blue) over the period 2000-2012 compared with the long term monthly average (red)